Grafana: Use Docker Compose for Grafana

Grafana is a great tool: "Query, visualize, alert on, and understand your data no matter where it’s stored. With Grafana you can create, explore, and share all of your data through beautiful, flexible dashboards."
In a modern production environment, I'd have a highly available system running Grafana, using a highly available database like PostgreSQL. But for tests, or for monitoring my private systems at home, a Docker container using an internal SQLite3 database is quite sufficient.
This is my docker-compose.yml:
services:
  grafana:
    image: grafana/grafana
    restart: always
    ports:
      - 3000:3000
This image is for the latest Grafana image. If you really want to use the latest and greatest, you could use the image grafana/grafana:main.
# docker compose pull
# docker compose up -d
[+] Pulling 11/11
✔ grafana Pulled 60.4s
✔ 9986a736f7d3 Pull complete 2.9s
✔ 964673342e9a Pull complete 3.0s
✔ 5029947686e2 Pull complete 3.9s
✔ 5ba2b039d79b Pull complete 4.0s
✔ 468a8bebbb4c Pull complete 4.1s
✔ 732ec2fc7d41 Pull complete 4.1s
✔ ad0fc1945d05 Pull complete 45.4s
✔ 61fcbf42041f Pull complete 58.1s
✔ 42e8e73f7720 Pull complete 58.2s
✔ 9b4925e32b92 Pull complete 58.3s
[+] Running 2/2
✔ Network grafana_default Created 0.2s
✔ Container grafana-grafana-1 Started 6.5sAfter starting, we can have a look at the logs:
# docker compose logs -fgrafana-1 | logger=settings t=2025-01-17T08:59:41.669984635Z level=info msg="Starting Grafana" version=11.4.0 commit=b58701869e1a11b696010a6f28bd96b68a2cf0d0 branch=HEAD compiled=2025-01-17T08:59:41Z
grafana-1 | logger=settings t=2025-01-17T08:59:41.671439108Z level=info msg="Config loaded from" file=/usr/share/grafana/conf/defaults.ini
grafana-1 | logger=settings t=2025-01-17T08:59:41.671497867Z level=info msg="Config loaded from" file=/etc/grafana/grafana.ini
grafana-1 | logger=settings t=2025-01-17T08:59:41.671513459Z level=info msg="Config overridden from command line" arg="default.paths.data=/var/lib/grafana"
[...]
grafana-1 | logger=plugins.registration t=2025-01-17T09:00:02.33370116Z level=info msg="Plugin registered" pluginId=grafana-lokiexplore-app
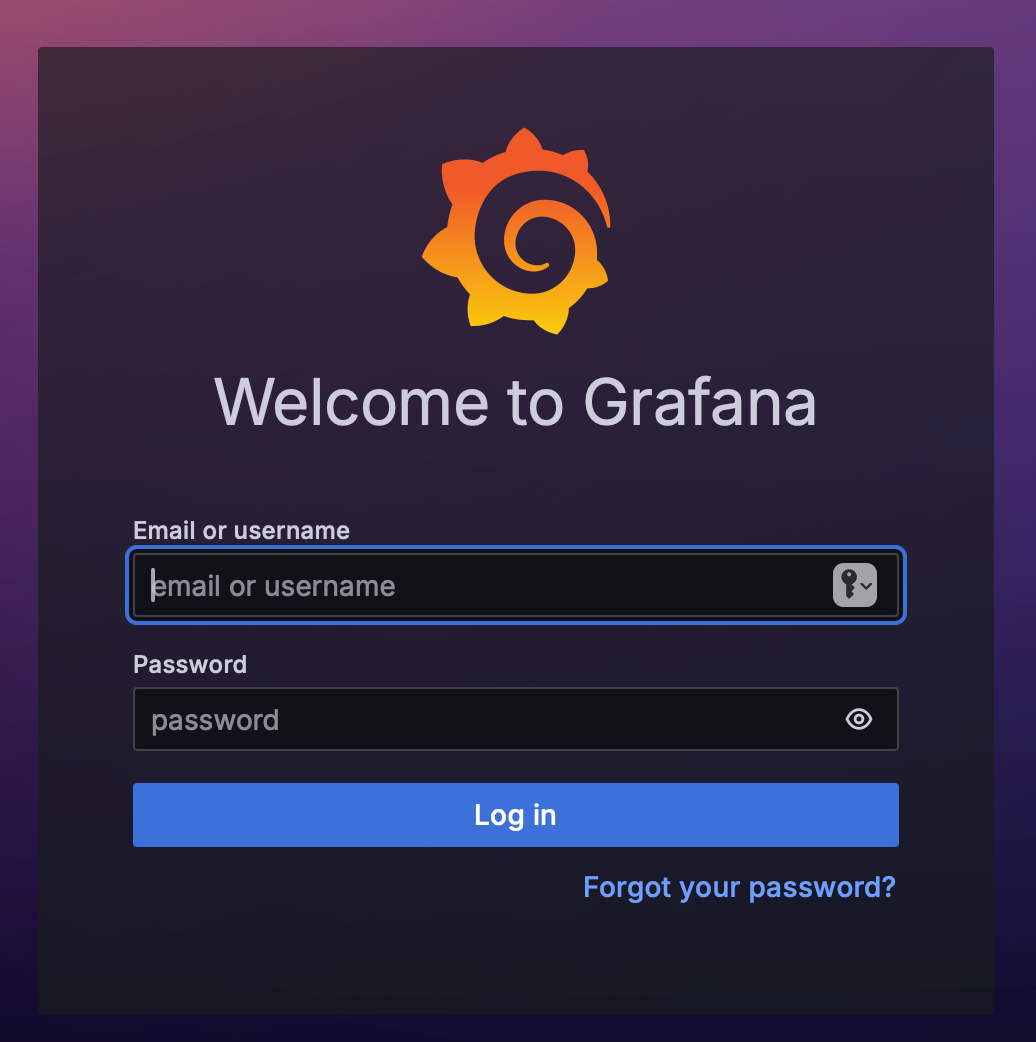
grafana-1 | logger=plugin.backgroundinstaller t=2025-01-17T09:00:02.333791641Z level=info msg="Plugin successfully installed" pluginId=grafana-lokiexplore-app version= duration=3.104679193sAfter that, you can log in to Grafana using the URL http://hostname:3000.

First login is admin:admin. You should change that immediately. Then, you are ready to use Grafana for monitoring.
Please note that this connection is using HTTP instead of HTTPS. So either use it in a secure environment, or use something that provides a secure connection, like a secured webserver.