Grafana: Using Telegraf and Grafana for Linux monitoring
If you use Telegraf to extract metrics from your systems, and you write them to InfluxDB, you can use Grafana to visualize the data we collected before.
Configure InfluxDB as data source
To use the data from within Grafana, we have to create a data source.
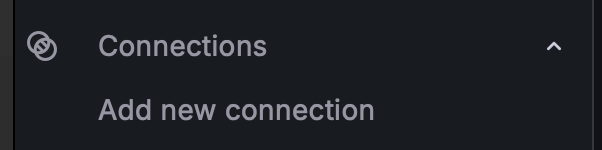
Go to Connections and add new connection:
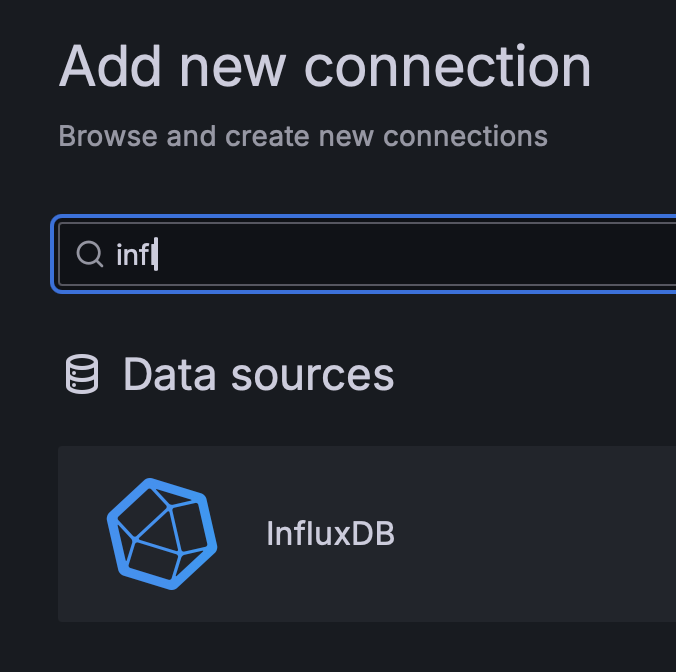
You can now add InfluxDB as a data source:

Enter the parameters to your InfluxDB:
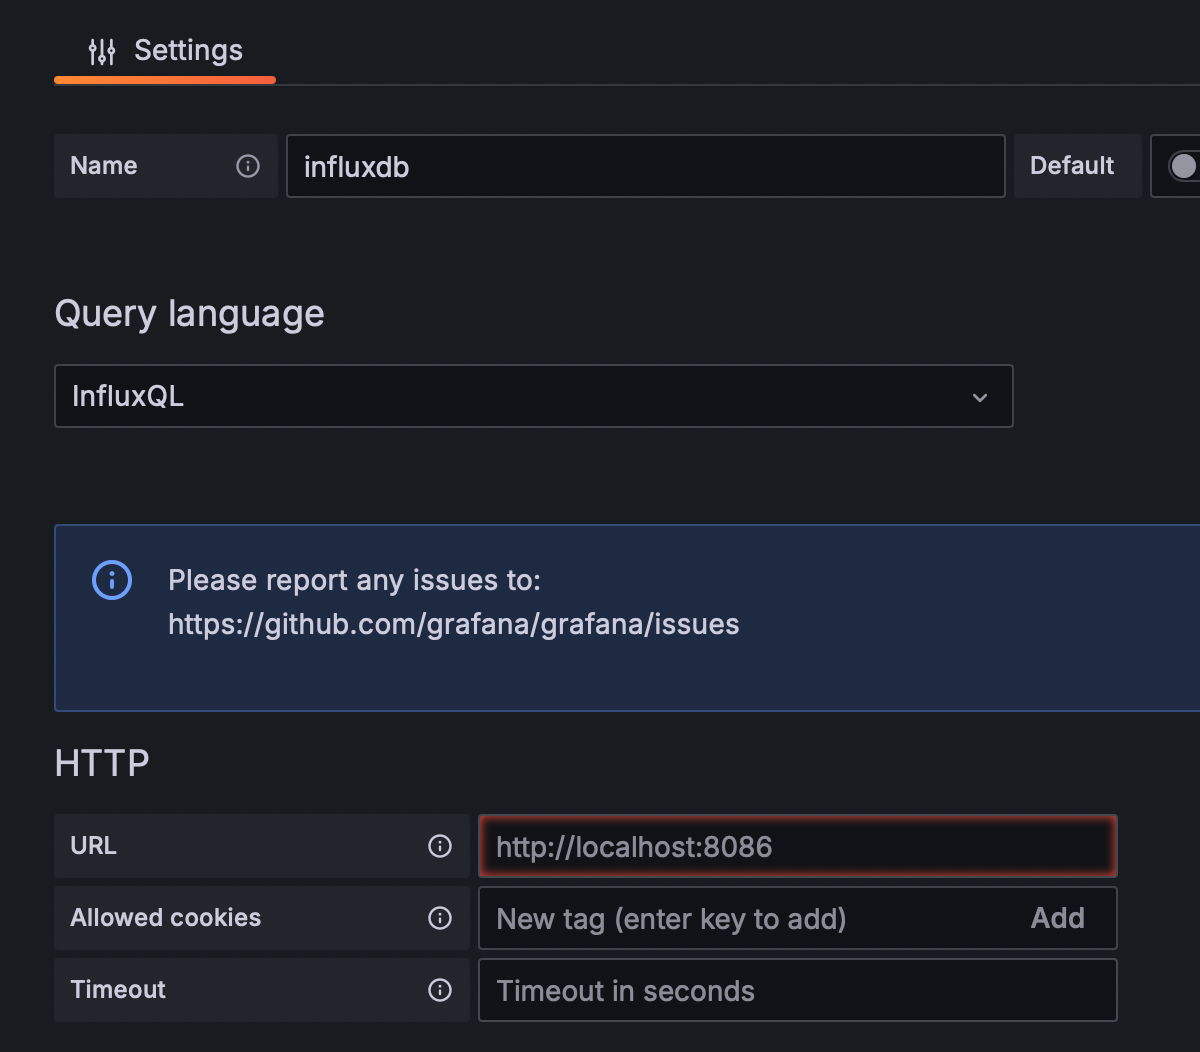
Choose a name for it to make sure that you don't come into confusions. I'll choose influxdb-telegraf-docker.
Import the dashboard
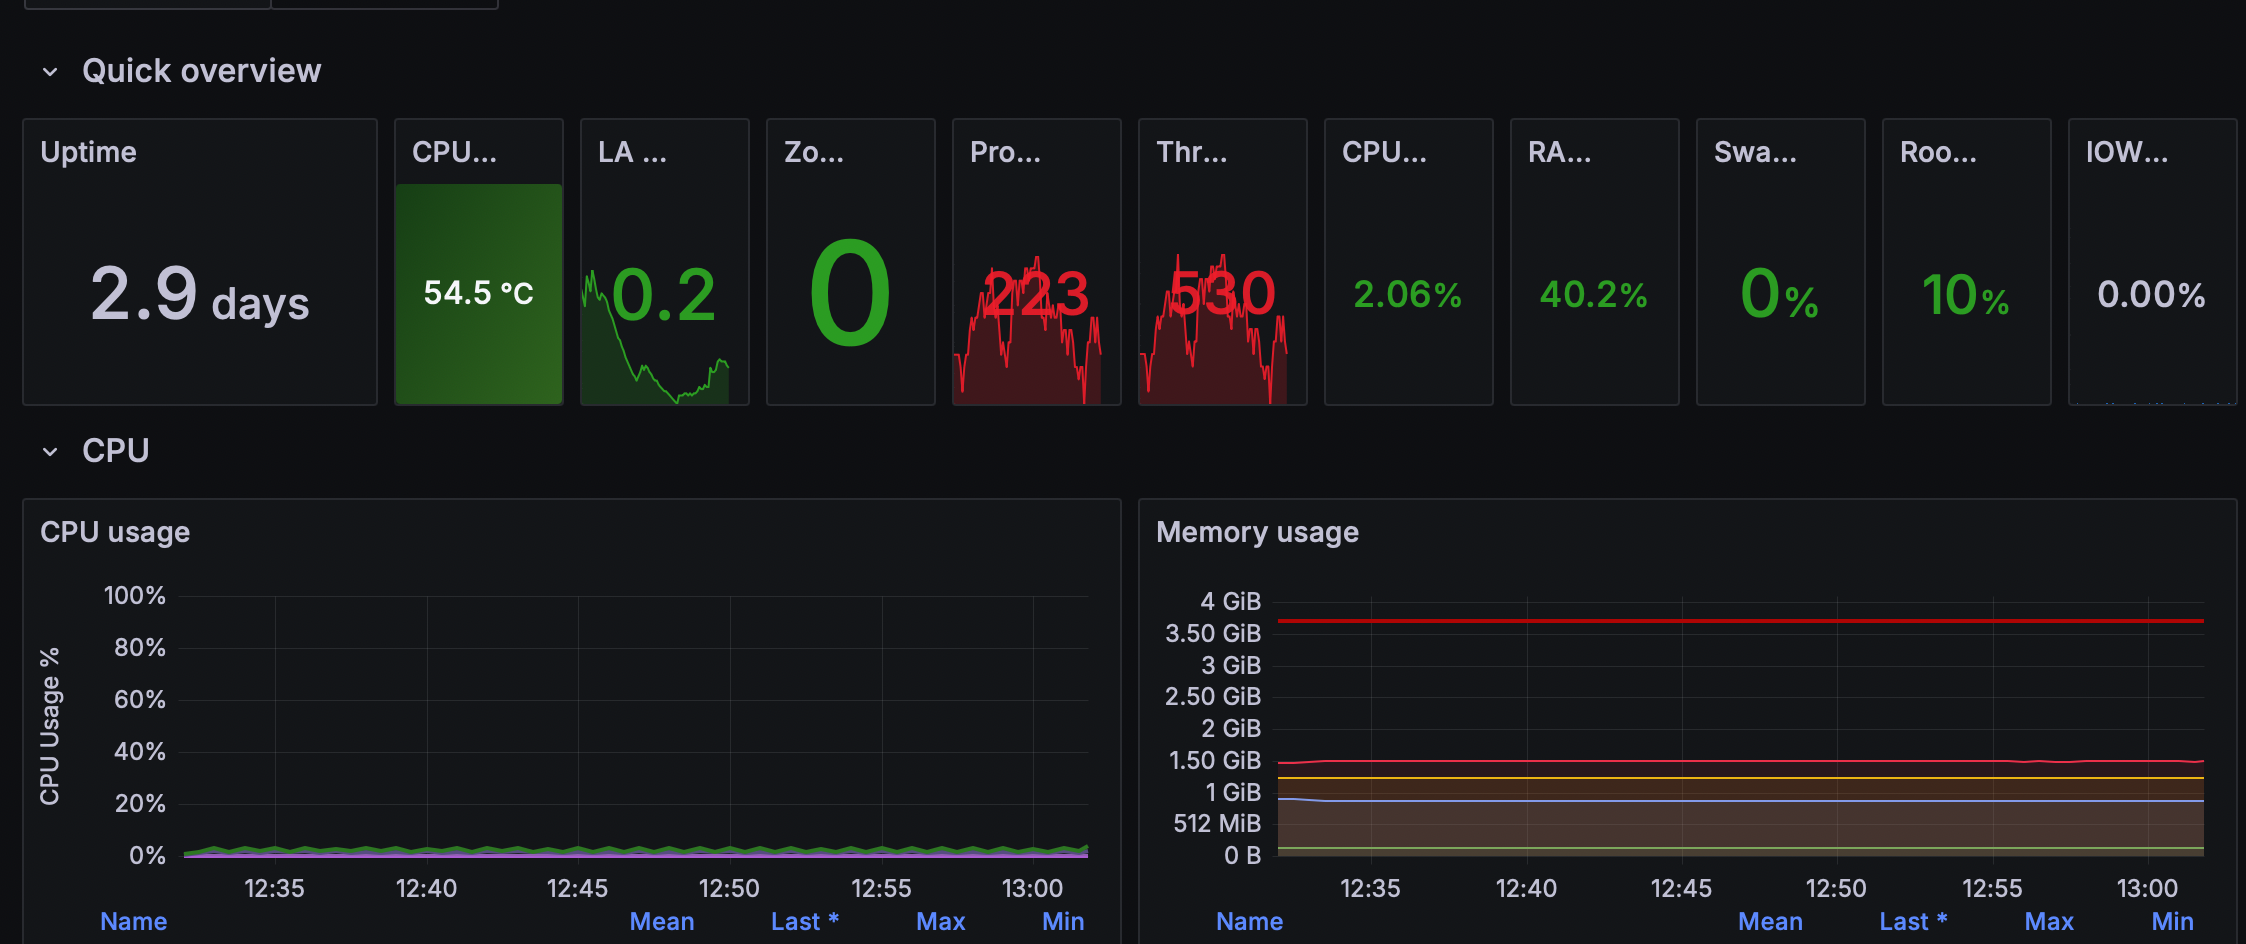
Jorge de la Cruz created a great dashboard for Raspberry Pi monitoring. As Raspberry Pi mostly runs Linux, we can use this dashboard for our Linux monitoring.
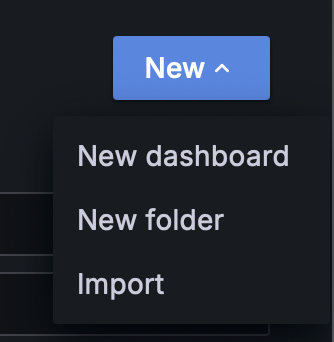
To import it, go to Dashboards, select the folder you want to use for it, and import the dashboard:
The easiest way would be to use just the ID of the dashboard:

At the bottom, select the data source you created in the first step:
After a few minutes, the dashboard shows the data:
Happy monitoring 😄