Oracle: Use Grafana for Oracle OCI Monitoring
How to use Grafana to monitor your OCI resources
Oracle's Cloud Infrastructure (OCI) is a great thing to hold all your Oracle resources within the cloud. But especially when you're also having resources on premise, it's not easy to hold all your monitoring data within the same tool.
You could use Oracle Enterprise Manager Cloud Control, which still is the best monitoring tool for all Oracle products. But there's also a way to visualize all your Oracle monitoring information: Grafana.
Grafana is great for visualizing data in dashboards. It just needs a data source.
Preparation
In order to access Oracle OCI, you'll have to prepare a few things; if you already have configured ocicli, you can just go on to the next step.
These are the things we need:
- Tenancy
The tenancy we want to do monitoring for.
- Region
The main region out resources are running in.
- User
This is the user we want to use. Doesn't matter if it's a natural user or a user only for special functions.
- Fingerprint
This is the fingerprint of the public key we use for communication. it should look like 00:11:22:33:44:55:66:77:88:99:aa:bb:cc:dd:ee:ff.- Key file
This is the private key we use for communication.
If you need further information about that, just see the Oracle documentation.
Configure Grafana
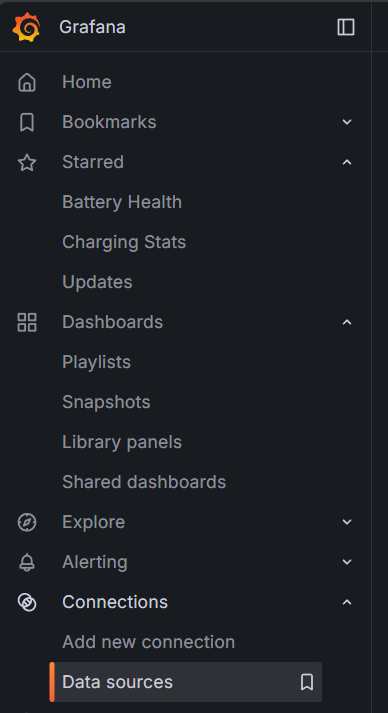
To use Oracle OCI as a data source, go to Connections -> Data sources:
Then

Type oracle in the filter, and you'll see two data source types:
- Oracle Cloud Infrastructure Logs
- Oracle Cloud Infrastructure Metrics
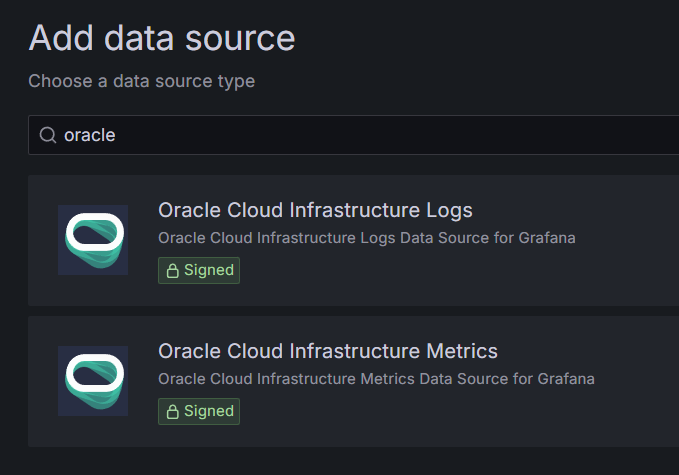
Logs are produced by resources (access logs, error logs, etc.), and metrics are information about resources, gathered while running, like CPU usage, disk throughput, etc.
So let's use the Oracle Cloud Infrastructure Metrics to monitor our resources in the OCI:

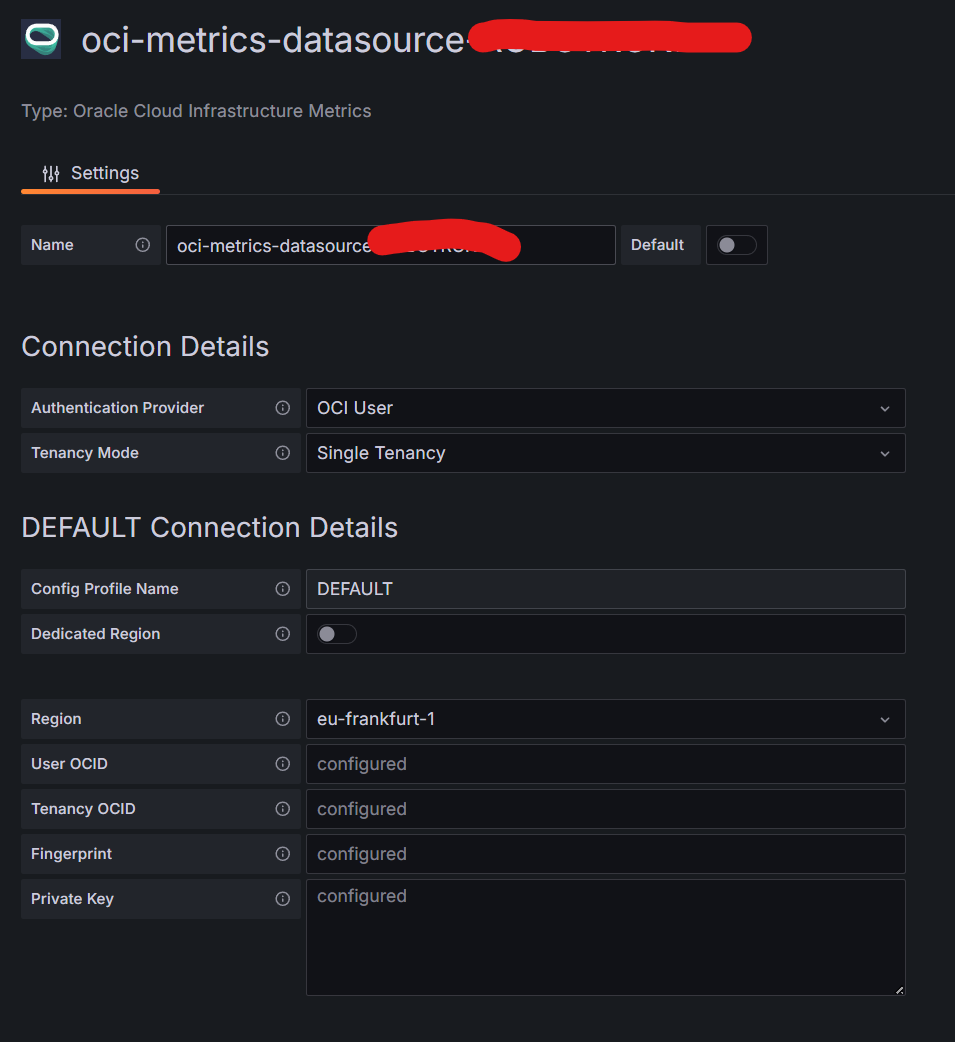
A confiugration will open, and you will have to enter your data for OCI connection:
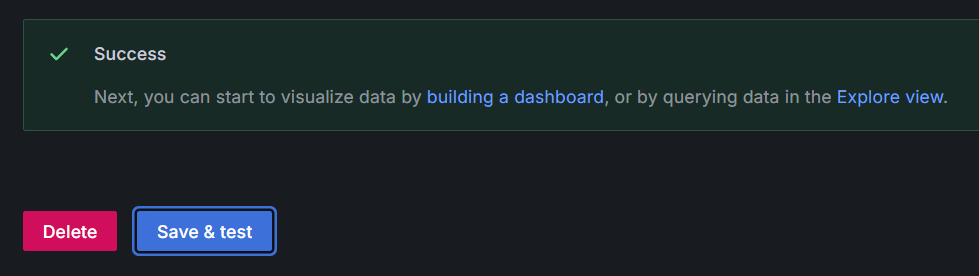
After entering all the data, we can click Save & test. if everything's fine, we see this information.
If we go to Explore view, we can now see which data is included. In my case, I just used Dataspace oci_database and Metric CpuUtilization, which is enough to see the first graphs:
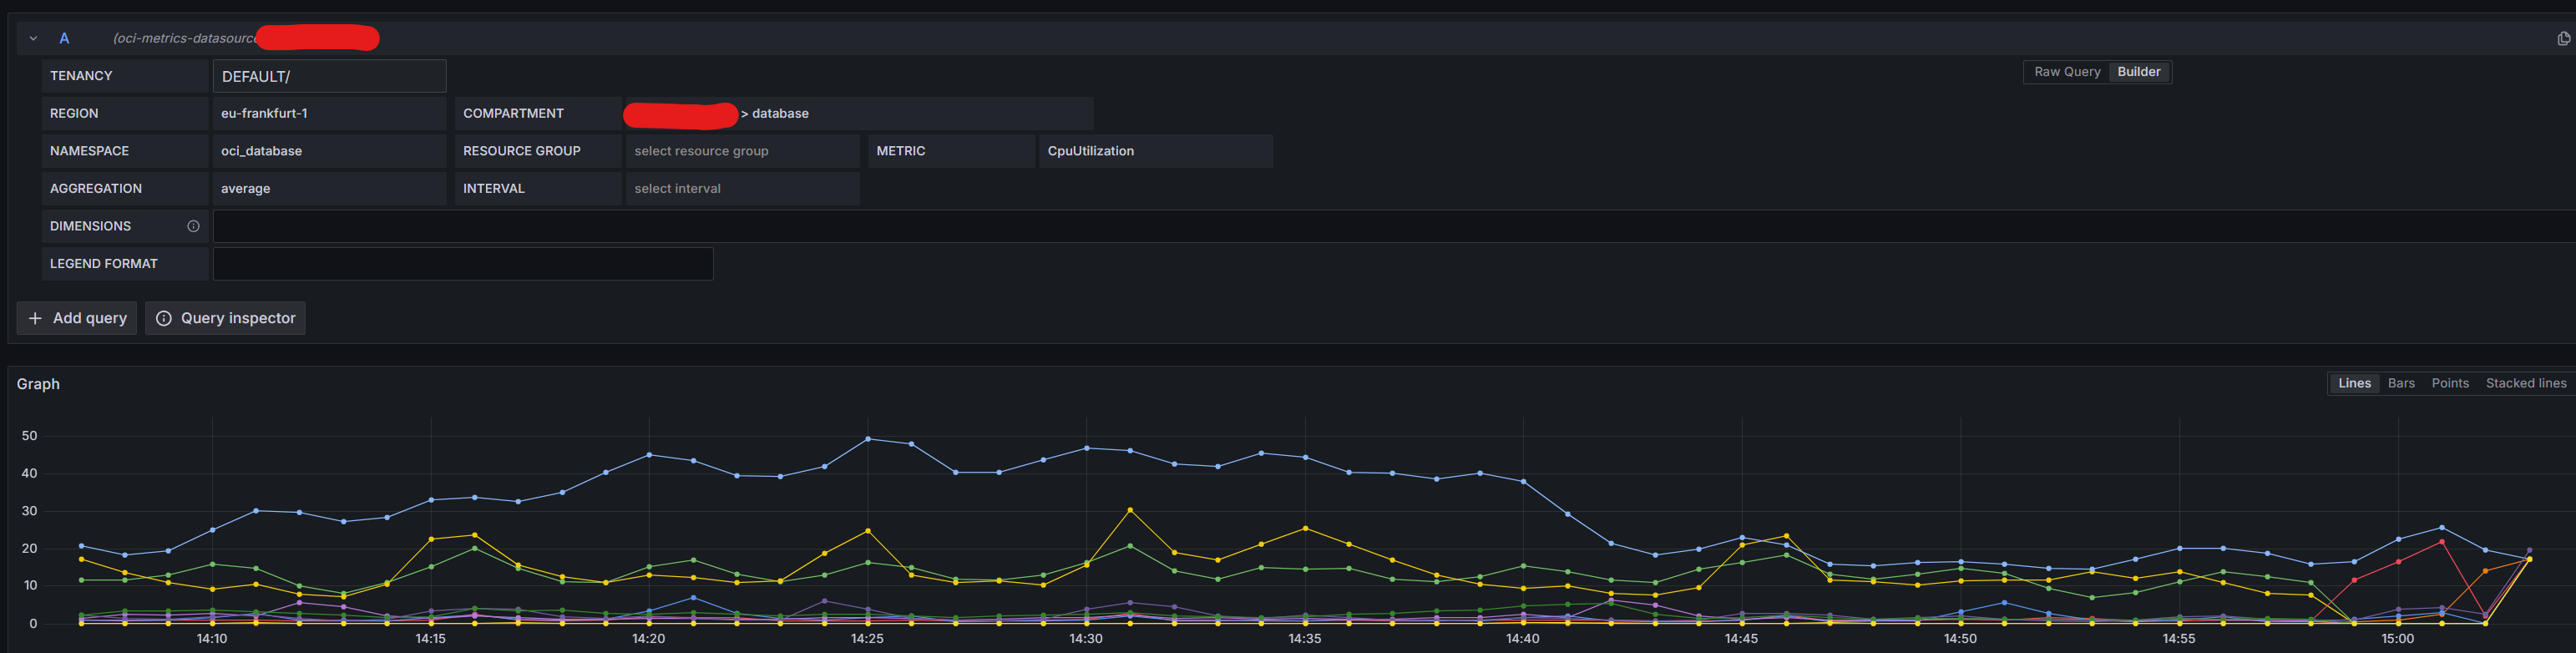
Happy monitoring 😄