PostgreSQL: Use CheckMk to monitor PostgreSQL

CheckMk is a great tool for monitoring. But it does not only do that for operation systems, you will also be able to monitor your PostgreSQL databases.
To do that, you'll need two things:
- The PostgreSQL plugin
- A configuration file
To get the PostgreSQL plugin, you can download it using this link:
http://<CheckMk server>:<Port>/cmk/check_mk/agents/plugins/mk_postgres.pyThis file has to be copied to
/usr/lib/check_mk_agent/pluginsAfter that, we can create the configuration file:
cat /etc/check_mk/postgres.cfg
DBUSER=postgres
As my database is configured to allow local logins without password, this configuration is enough.
Let's test it:
# cd /usr/lib/check_mk_agent/plugins
# ./mk_postgres.py
<<<postgres_instances>>>
[[[main]]]
10642 /usr/lib/postgresql/17/bin/postgres -D /var/lib/postgresql/17/main -c config_file=/etc/postgresql/17/main/postgresql.conf
10645 postgres: 17/main: checkpointer
10646 postgres: 17/main: background writer
10648 postgres: 17/main: walwriter
10649 postgres: 17/main: autovacuum launcher
10650 postgres: 17/main: logical replication launcher
<<<postgres_sessions>>>
[[[main]]]
f 1
t 0
[...]
[databases_end]
db;schemaname;tablename;tups;pages;otta;tbloat;wastedpages;wastedbytes;wastedsize;iname;itups;ipages;iotta;ibloat;wastedipages;wastedibytes;wastedisize;totalwastedbytes
postgres;pg_catalog;pg_class;415;14;12;0.143;2;16384;16384;pg_class_tblspc_relfilenode_index;415;2;10;0.000;0;0;0;16384
postgres;pg_catalog;pg_class;415;14;12;0.143;2;16384;16384;pg_class_oid_index;415;4;10;0.000;0;0;0;16384
postgres;pg_catalog;pg_class;415;14;12;0.143;2;16384;16384;pg_class_relname_nsp_index;415;5;10;0.000;0;0;0;16384
postgres;pg_catalog;pg_description;5226;45;44;0.022;1;8192;8192;pg_description_o_c_o_index;5226;26;32;0.000;0;0;0;8192
postgres;pg_catalog;pg_attribute_relid_attnum_index;3126;11;0;1.000;11;0;0;?;0;0;0;0.000;0;0;0;0
postgres;pg_catalog;pg_class_oid_index;415;4;0;1.000;4;0;0;?;0;0;0;0.000;0;0;0;0
postgres;pg_catalog;pg_type_oid_index;617;4;0;1.000;4;0;0;?;0;0;0;0.000;0;0;0;0
postgres;pg_catalog;pg_attrdef_adrelid_adnum_index;0;1;0;1.000;1;0;0;?;0;0;0;0.000;0;0;0;0
postgres;pg_catalog;pg_attribute_relid_attnam_index;3126;15;0;1.000;15;0;0;?;0;0;0;0.000;0;0;0;0
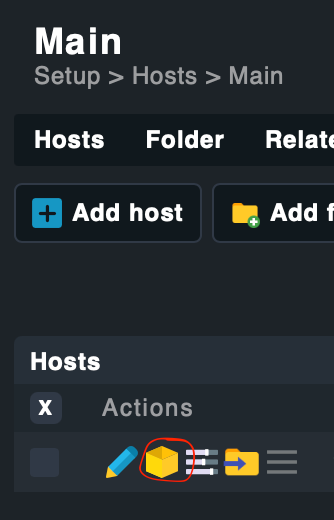
postgres;pg_catalog;pg_class_tblspc_relfilenode_index;415;2;0;1.000;2;0;0;?;0;0;0;0.000;0;0;0;0In CheckMk, we can now edit the host where the PostgreSQL plugin was deployed, and search for new services:
New services for PostgreSQL should now be displayed:
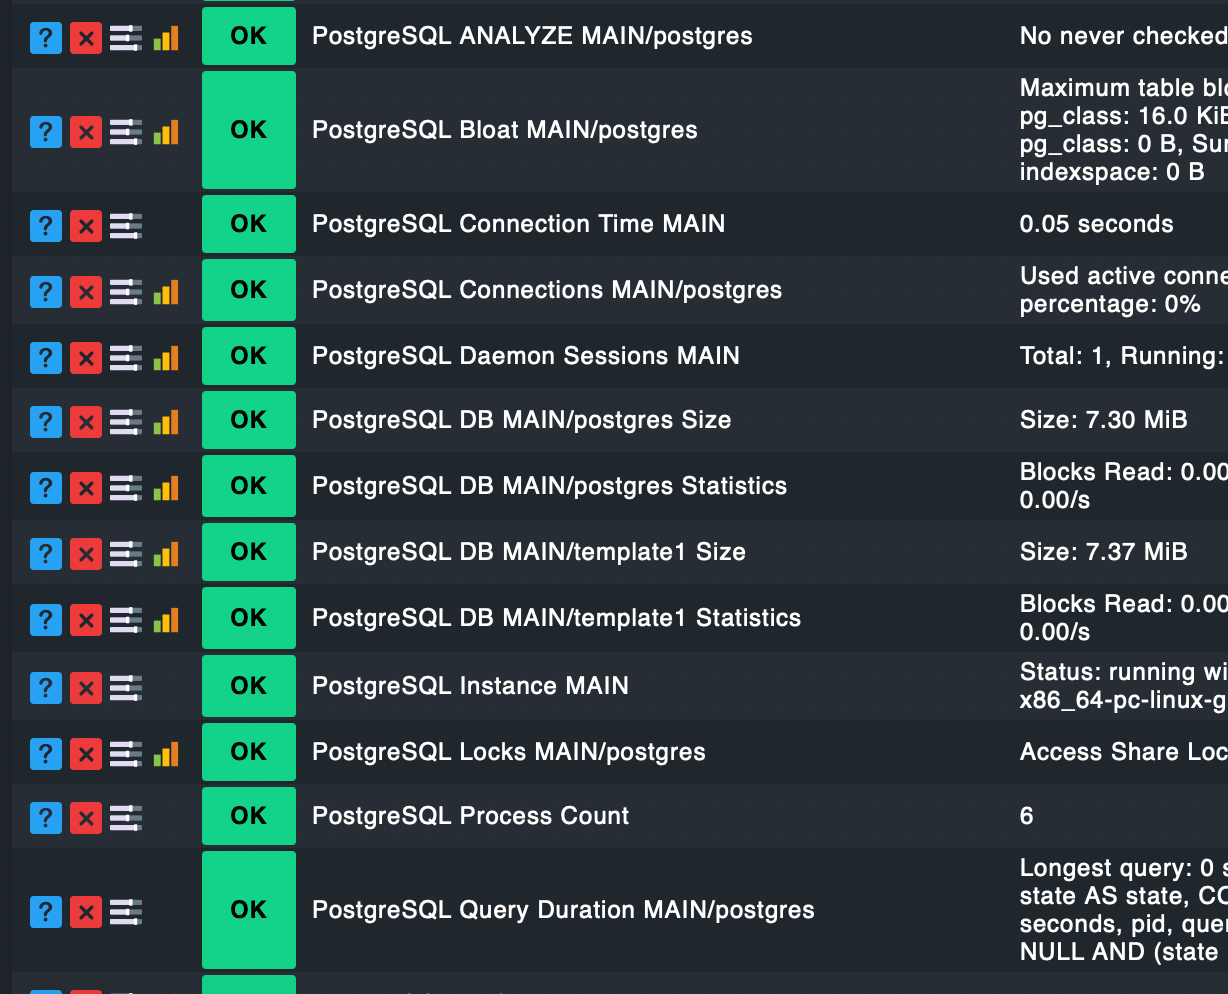
You can decide to monitor them

and activate the changes:

After that, PostgreSQL is configured in CheckMk.
Happy monitoring 😄